Rasdaman @ Spatial Ecology

 What’s in store – raster data manager at week 2 of our summer school?Rasdamanbig

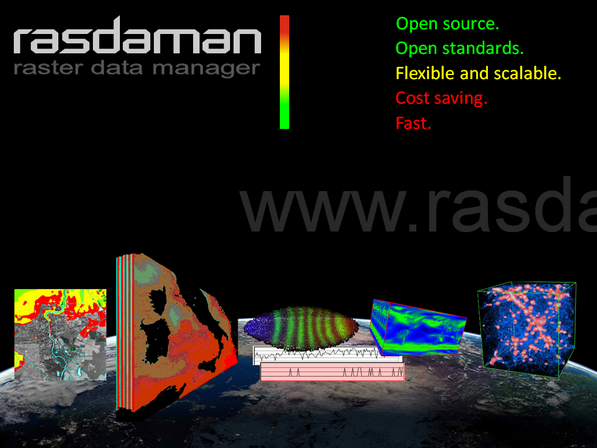
This year we’re adding on to the summer school program with a second week of intensive, hands on training on open source GIS software packages PLUS hands on spatial data collection using drones. This program is enriched by our partnership with Professor Peter Baumann of Jacobs University in Bremen, Germany. Dr. Baumann’s research interests include Array (“Raster”) Databases and co-developed the leading raster analytics engine, http://www.rasdaman.org Rasdaman  championed as the fastest array database on earth, not to mention it is completely open source!

This new second week of summer school will build on skills developed in the first week, but will include drone flight demonstrations for high resolution data collection. Student will learn how to pilot a quadcopter fitted with a IXUS 400 16 megapixel camera, and learn how to auto trigger the camera and program flight plans for the drone.

These raster data collected by students will be processed over the week, and on Day 4 of the program, two team members of Dr. Baumann’s working group will walk students through the rasdaman array model and query language. This session will give students hands-on experience with importing data into rasdaman and processing three types of coverages.

Dr. Baumann’s team members are Alex Dimitru and Vlad Merticariu.

Alex Dumitru is a PhD candidate and plays a central role in issuing rasdaman WCS (Web Coverage Service) and WCPS (Web Coverage Processing Service). He is a senior software engineer for rasdaman and a managing partner with Flanche Creative Labs.

Vlad Merticariu is also a lead contributor to rasdaman and the OGC WCS standard. His research interest is parallel query processing and the collaboration of machine networks for rapid array database query responses. He is a PhD candidate at Jacobs University and has a number of publications with Bauman and Dumitru focused on such topics as Big Data, cloud computing, array databases, and on-board sensors for array data collection.

Spatial Ecology is very proud to have Alex and Vlad on site during the second week of the 2016 Summer School. Their expertise is sure to be a valuable component of the course, and students this summer will surely benefit from their engagement. Our partnership with Baumann is effectively broadening the reach of open source software and is a great example of the collaboration that can develop as a result.

Summer School re-cap week 1

Re-cap of our training on ‘Spatio-temporal data analysis using free and open source software’

Week 1 of Summer School 2016 (#SummerSchool2016) wrapped up on Friday June 10 with an entire day dedicated to Python, demonstrated primarily by Francesco Lovergine. The course, consisting of nearly 30 students, first introduced several other coding languages in the time leading up to Python. In fact, were it not for the building up of coding language and syntax in these other languages, a lesson in Python would be irrelevant. This post takes a general look at the cornerstone lesson that was a launching point for the rest of the week.

Monday opened with a statement of the expected learning curve that exists for students of coding. This was presented partly as a disclaimer and partly as words of encouragement. Importantly, beginner coders (or students with virtually no coding experience coding) should expect to be challenged; and rightly so because coding is challenging. Nonetheless, the objective of the course is to empower students by providing the tools to teach themselves, and pointing the way to the free online resources necessary for climbing the learning curve.

learningCurve

The class continued with a discussion of why open source software (OSS) is important for GeoComputation of Big Data, and how Processing Efficiency and Research Reproducibility is important for researching the large-scale data that often defines the Anthropocene.

” A variety of programming languages were introduced, beginning with BASH, then rapidly moving on to AWK, GDAL, GRASS, PKtools, R and finally Python…”

So, how did the course fare in covering such complex topics while also teaching command-line coding skills? To begin with, students are given an impressive suite of software that is accessed in a packaged operating system that runs parallel to the current operating systems on student computers. This operating system is known as Lubuntu Virtual Machine (LVM). Students are guided through the installation of LVM on their personal computers. The LVM package includes QGIS, Gimp, Python (and IDLE), R, GDAL, GRASS, SAGA GIS, Postgres, SpatialLite, Leaflet, and Rasdaman. Both GUI and scripting libraries are bundled in this light-weight operating system.

The course then concentrated on basic commands in the Bash coding language in the Linux Terminal. These basic commands, including

man [command]

more [file]

head [file]

tail [file]

and many others were used again and again in subsequent lessons focused on different coding languages. Students were also exposed to scripting several commands using the pipe ( | ) metacharacter, as well as several other special characters used to query large arrays of data, directories, and files.

” from this student’s perspective, having even the most basic Python interface explained will be incredible useful…”

Importantly, the lessons incorporated the online resources available through the Spatial Ecology wiki page, to guide students independently following up on topics introduced. The course was extremely diverse in terms of content and composition. A variety of programming languages were introduced, beginning with BASH, then rapidly moving on to AWK, GDAL, GRASS, PKtools, R, and finally Python. Along the way the integration of each of these scripting languages within one another, importing their respective libraries, and QGIS was presented. For many students, understanding how the various coding languages can be integrated with one another, and how to expand the possible applications by importing programming libraries, set a stage for future applications to their own datasets.

The week closed with a lesson in Python, which, as any Python user knows, cannot possibly be completely taught in one day. However, from this student’s perspective, having even the most basic Python interface explained will be incredibly useful for those who are motivated to teach themselves using online, open-source resources. The final slide students saw was the learning curve slide (above). The instructors pressed students to consider where on the learning curve they were at the start of the course, and where they were on Day 5. I doubt any students failed to advance their coding skills. While the instructors only joked about students giving up entirely, it is a sure bet that being equipped with the LVM, websites for following up on topics covered, and having a forum for asking experts questions was empowering, and well-aligned with Spatial Ecology’s mission statement.