Deep Learning with Python @ Matera 2017

Webinar: Earth Observation Data and Smart Analytic with Python: Tom Jones (Satellite Applications Catapult, Harwell, UK) – Thu. 22 June 2017, 16:00 CET.

During this year’s summer school in Matera 2017 Tom Jones will give us a very interesting insight into emerging Deep Learning technology applied to Earth Observation Satellite Data processing.

Tom is an Earth Observation (EO) Specialist within the Applied Digital Intelligence team at the Satellite Applications Catapult. He holds an MSc in Remote Sensing and Geographical Information Systems from Aberystwyth University and has previous experience within commercial remote sensing organisations including NM Group Ltd and Environment Systems Ltd.

Within his MSc Tom undertook innovative research within the field of EO and smart analytics, in particular the exploration of uses for machine learning in automating change detection and classification.

Since joining the Catapult 19 months ago, Tom’s activities have included leading technical innovation centred around developing sustainable and scalable open source tools for enabling routine exploitation of EO datasets, for example applications of machine learning and SAR technologies for agricultural applications, and providing technical expertise into myriad other application areas, projects and stakeholder engagements.

In his webinar presentation, Tom shall introduce a variety of commercial and open source satellite Earth observation datasets and give a short demonstration of an end-to-end process exploiting these using open source machine learning techniques to generate land cover classification maps.

Key things covered in presentation:

  1. Introduction to Earth observation & state of the art commercial satellite imagery
  2. Highlighting key components for generating a satellite
  3. Derived land cover classification
    Demo :
    – Libraries: ARCSI, RSGISLib, sk-learn, numpy etc.
    – Key processes: atmospheric correction, segmentation, machine learning classification, accuracy assessment
    – Potential bonus: classification using a deep learning technique

Presentation@Harvard

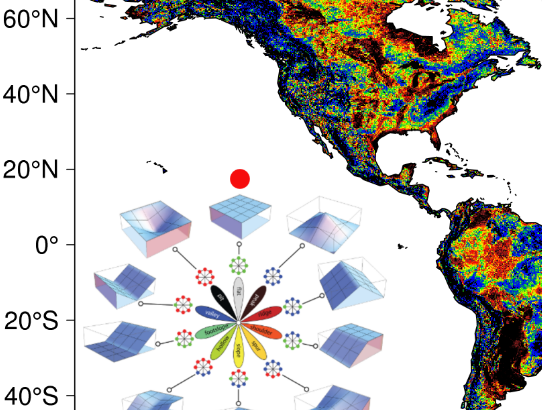
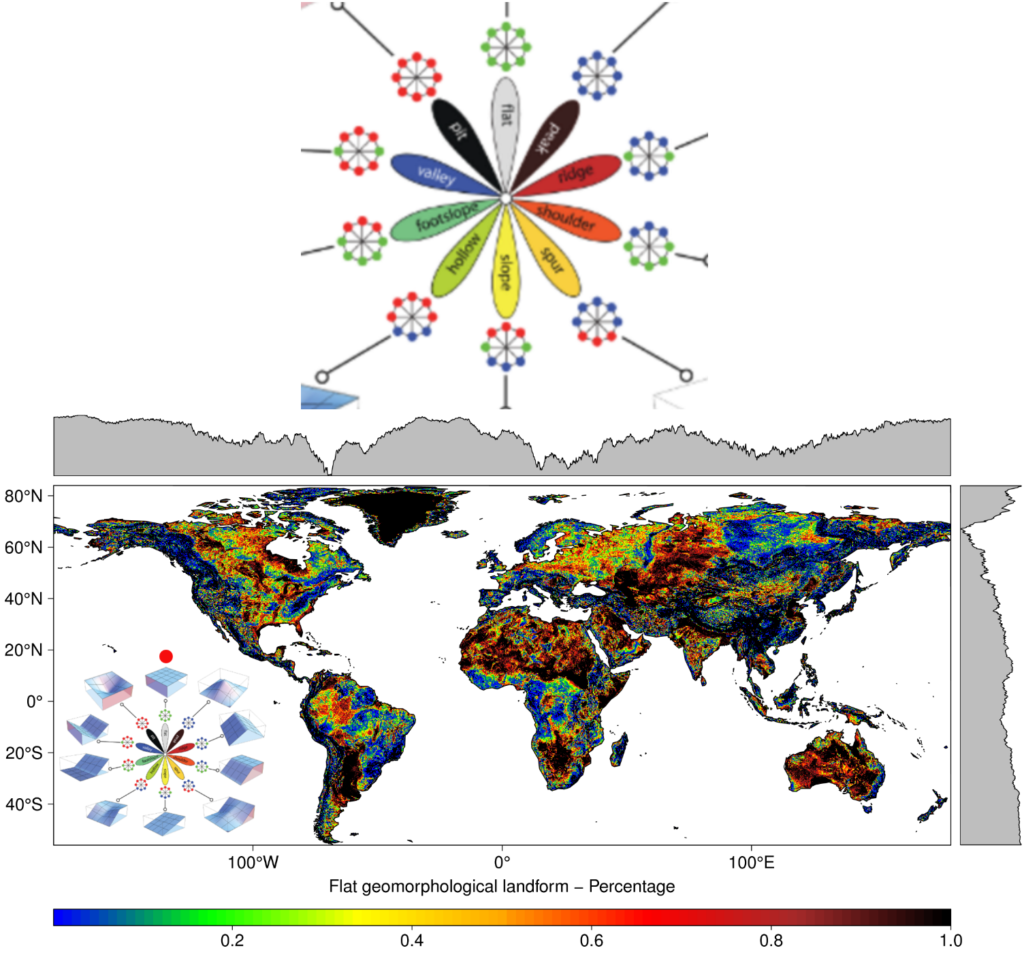
Dr G. Amatulli presents ‘Big Data meets Geo-Computation’ @Harvard University, Cambridge – info.

Big Data meets Geo-Computation: Combining research reproducibility and processing efficiency in high-performance computing
By Giuseppe Amatulli, Ph.D.

Thursday, May 4th 12:00pm – 1:30pm. CGIS South Building, Room S354.

Abstract: In recent years there has been an explosion of geo-datasets derived from an increasing number of remote sensors, field instruments, sensor networks, and other GPS-equipped “smart” devices. “Big Data” processing requires flexible tools that combine efficient processing, either on your local pc or on remote servers (e.g, clusters – HPCs). However, leveraging these new data streams requires new tools and increasingly complex workflows often involving multiple software and/or programming languages. This also the case for GIS and Remote Sensing analysis where statistical/mathematical algorithms are implemented in complex geo-spatial workflows. I will show few examples of environmental applications where I combine different open-source geo-libraries for a massive computation at Yale Center for Research Computing.
Speaker Bio: Giuseppe is a Research Scientist in GeoComputation and Spatial Science at Yale’s Center for Research Computing. His research activities are mainly dedicated to spatial modeling with a special emphasis in species distribution models, areal distribution and potential shift under climate change conditions, wildland fire occurrence and pattern recognition, and wildfire risk assessment based on human and bio-physical parameters. Giuseppe holds an M.Sc. in Forestry from Bari University (Italy), a M.Sc. in Geo-Information Science from Wageningen University (The Netherlands), and a Ph.D. from the University of Basilicata (Italy).
Lunch will be served.

GWmodel R package @ Spatial Ecology

During this year’s summer school in Matera 2017 Dr. Paul Harris from Rothamsted Research will give us a very interesting insight into the R GWmodel package.

Introduction to the GWmodel R package
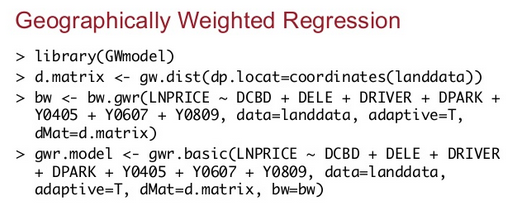
In this presentation, geographically weighted (GW) models are introduced. GW models suit situations when data are not described well by some global model, but where there are regions where a localised calibration provides a better description. The approach uses a moving window weighting technique, where localised statistical models are found at target locations. Outputs are commonly mapped to provide a useful exploratory tool into the nature of spatial heterogeneity. GWmodel includes functions for GW summary statistics, GW principal components analysis, GW discriminant analysis and various forms of GW regression, together with useful diagnostics and tests.


Image result for gwmodel r cran

Lecturer:

Paul Harris is a Senior Research Scientist at Rothamsted Research in the UK. His research focuses on the development and application of spatial statistics to agricultural, ecological and environmental data.  He previously worked at the National Centre for Geocomputation in Maynooth, Ireland, where much of the work on GW models stems from.

Rasdaman @ Spatial Ecology

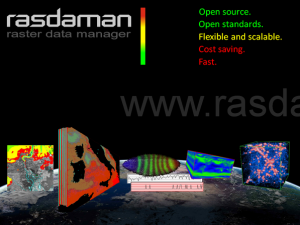
 What’s in store – raster data manager at week 2 of our summer school?Rasdamanbig

This year we’re adding on to the summer school program with a second week of intensive, hands on training on open source GIS software packages PLUS hands on spatial data collection using drones. This program is enriched by our partnership with Professor Peter Baumann of Jacobs University in Bremen, Germany. Dr. Baumann’s research interests include Array (“Raster”) Databases and co-developed the leading raster analytics engine, http://www.rasdaman.org Rasdaman  championed as the fastest array database on earth, not to mention it is completely open source!

This new second week of summer school will build on skills developed in the first week, but will include drone flight demonstrations for high resolution data collection. Student will learn how to pilot a quadcopter fitted with a IXUS 400 16 megapixel camera, and learn how to auto trigger the camera and program flight plans for the drone.

These raster data collected by students will be processed over the week, and on Day 4 of the program, two team members of Dr. Baumann’s working group will walk students through the rasdaman array model and query language. This session will give students hands-on experience with importing data into rasdaman and processing three types of coverages.

Dr. Baumann’s team members are Alex Dimitru and Vlad Merticariu.

Alex Dumitru is a PhD candidate and plays a central role in issuing rasdaman WCS (Web Coverage Service) and WCPS (Web Coverage Processing Service). He is a senior software engineer for rasdaman and a managing partner with Flanche Creative Labs.

Vlad Merticariu is also a lead contributor to rasdaman and the OGC WCS standard. His research interest is parallel query processing and the collaboration of machine networks for rapid array database query responses. He is a PhD candidate at Jacobs University and has a number of publications with Bauman and Dumitru focused on such topics as Big Data, cloud computing, array databases, and on-board sensors for array data collection.

Spatial Ecology is very proud to have Alex and Vlad on site during the second week of the 2016 Summer School. Their expertise is sure to be a valuable component of the course, and students this summer will surely benefit from their engagement. Our partnership with Baumann is effectively broadening the reach of open source software and is a great example of the collaboration that can develop as a result.

Summer School re-cap week 1

Re-cap of our training on ‘Spatio-temporal data analysis using free and open source software’

Week 1 of Summer School 2016 (#SummerSchool2016) wrapped up on Friday June 10 with an entire day dedicated to Python, demonstrated primarily by Francesco Lovergine. The course, consisting of nearly 30 students, first introduced several other coding languages in the time leading up to Python. In fact, were it not for the building up of coding language and syntax in these other languages, a lesson in Python would be irrelevant. This post takes a general look at the cornerstone lesson that was a launching point for the rest of the week.

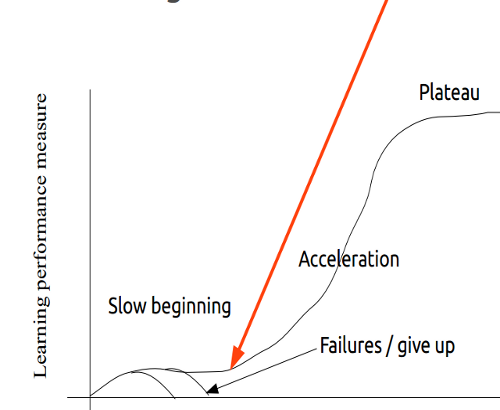
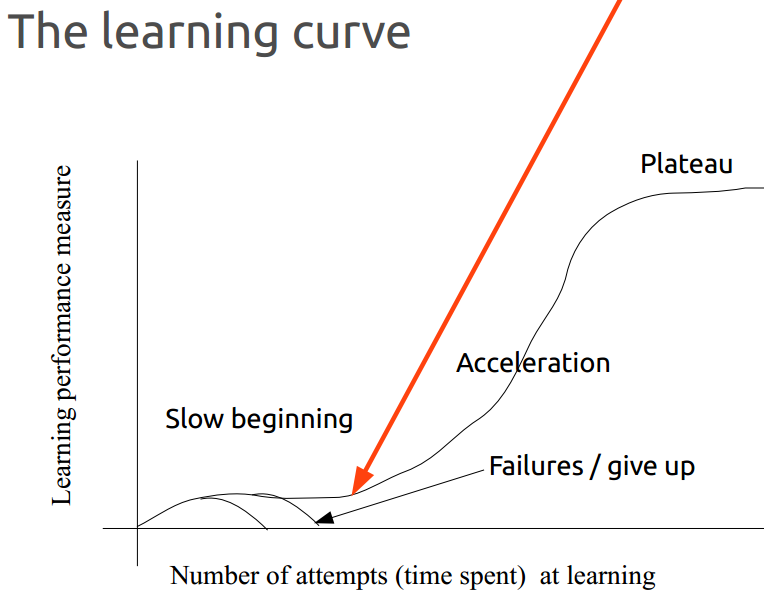
Monday opened with a statement of the expected learning curve that exists for students of coding. This was presented partly as a disclaimer and partly as words of encouragement. Importantly, beginner coders (or students with virtually no coding experience coding) should expect to be challenged; and rightly so because coding is challenging. Nonetheless, the objective of the course is to empower students by providing the tools to teach themselves, and pointing the way to the free online resources necessary for climbing the learning curve.
learningCurve

The class continued with a discussion of why open source software (OSS) is important for GeoComputation of Big Data, and how Processing Efficiency and Research Reproducibility is important for researching the large-scale data that often defines the Anthropocene.

” A variety of programming languages were introduced, beginning with BASH, then rapidly moving on to AWK, GDAL, GRASS, PKtools, R and finally Python…”

So, how did the course fare in covering such complex topics while also teaching command-line coding skills? To begin with, students are given an impressive suite of software that is accessed in a packaged operating system that runs parallel to the current operating systems on student computers. This operating system is known as Lubuntu Virtual Machine (LVM). Students are guided through the installation of LVM on their personal computers. The LVM package includes QGIS, Gimp, Python (and IDLE), R, GDAL, GRASS, SAGA GIS, Postgres, SpatialLite, Leaflet, and Rasdaman. Both GUI and scripting libraries are bundled in this light-weight operating system.

The course then concentrated on basic commands in the Bash coding language in the Linux Terminal. These basic commands, including

man [command]

more [file]

head [file]

tail [file]

and many others were used again and again in subsequent lessons focused on different coding languages. Students were also exposed to scripting several commands using the pipe ( | ) metacharacter, as well as several other special characters used to query large arrays of data, directories, and files.

” from this student’s perspective, having even the most basic Python interface explained will be incredible useful…”

Importantly, the lessons incorporated the online resources available through the Spatial Ecology wiki page, to guide students independently following up on topics introduced. The course was extremely diverse in terms of content and composition. A variety of programming languages were introduced, beginning with BASH, then rapidly moving on to AWK, GDAL, GRASS, PKtools, R, and finally Python. Along the way the integration of each of these scripting languages within one another, importing their respective libraries, and QGIS was presented. For many students, understanding how the various coding languages can be integrated with one another, and how to expand the possible applications by importing programming libraries, set a stage for future applications to their own datasets.

The week closed with a lesson in Python, which, as any Python user knows, cannot possibly be completely taught in one day. However, from this student’s perspective, having even the most basic Python interface explained will be incredibly useful for those who are motivated to teach themselves using online, open-source resources. The final slide students saw was the learning curve slide (above). The instructors pressed students to consider where on the learning curve they were at the start of the course, and where they were on Day 5. I doubt any students failed to advance their coding skills. While the instructors only joked about students giving up entirely, it is a sure bet that being equipped with the LVM, websites for following up on topics covered, and having a forum for asking experts questions was empowering, and well-aligned with Spatial Ecology’s mission statement.

Grappolo taking center stage

Grappolo taking centre stagemagPi

Our very own grid engine cluster computer, Grappolo is featured in the June issue of MagPi (p10-11), a monthly magazine produced by RaspberryPi. The article, Flooding Workshop covers Spatial Ecology’s co-founder, Stefano Casalegno, Ph.D. and the workshop he ran during the annual Environment and Sustainability Day event hosted by the University of Exeter’s Environmental Sustainability Institute (ESI). The workshop, titled Flooding Risk, was attended by university students and demonstrated geospatial modelling techniques for assessing flood risk in Cornwall and Devon (UK). Flooding Risk was voted best workshop by students as the best of the day’s events.

So what exactly is MagPi’s interest in the event? One word: Grappolo. Grappolo is Italian for bunch, or cluster. Grappolo is a cluster of RaspberryPi hardware, an immensely powerful piece of computing hardware designed for teaching. Grappolo, then, is figuratively a ‘bunch of raspberries’, but offers much more. Grappolo simulates the functionality of the biggest cluster computing facility in the South West U.K., but its portability and design makes it an ideal tool for teaching Big Data processing methods, instead of serving as a raw computation device.

The students who participated in the workshop worked with Big Data from NASA’s Shuttle Radar Topography Mission, but also LiDAR data from the locally based Tellus project. These big datasets are exactly what Grappolo was designed to process, and the learning environment of the Flooding Risk workshop is the optimal forum for Grappolo to perform. Grappolo will also be used as a teaching tool in Spatial Ecology’s upcoming Summer School 2016 held in Matera, Italy. Grappolo provides a powerful processing environment while being both portable, and affordable, so we are very excited to have MagPi readers’ attention.


Presentation

Dr G. Amatulli presents ‘Big Data meets Geo-Computation’ @University of Texas, Austin – Info

Screenshot from 2016-04-04 23:12:10

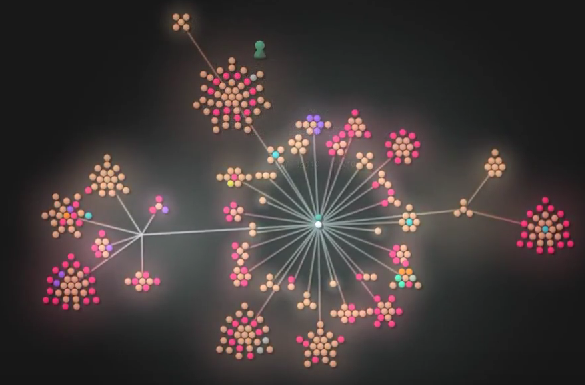
The development of the coding of all projects were carried on at Yale University. Each single point cluster identifies a project and each point in the cluster represents a scripting procedure.

Abstract:
In recent years there has been an explosion of geo-datasets derived from an increasing number of remote sensors, field instruments, sensor networks, and other GPS-equipped “smart” devices. “Big Data” processing requires flexible tools that combine efficient processing, either on your local pc or on remote servers (e.g, clusters – HPCs). However, leveraging these new data streams requires new tools and increasingly complex workflows often involving multiple software and/or programming languages. This also the case for GIS and Remote Sensing analysis where statistical/mathematical algorithms are implemented in complex geospatial workflows. I will show few examples of environmental applications where I combine different open-source geo-libraries for a massive computation at NASA Earth Exchange (NEX) Platform.

The animation has been produced by Gource with the following code line:

gource --file-idle-time 0 -s 1 --auto-skip-seconds 1 \\
--stop-at-end --title BTClient \\
--output-ppm-stream --r 25 /tmp/.git/ | \\
ffmpeg -y -r 25  -f image2pipe -vcodec ppm -i \\
--vcodec libx264 -preset medium -vprofile baseline \\
-level 3.0 -pix_fmt yuv420p gource.mp4