Using GRASS for stream-network extraction and basins delineation
Methodological procedure described in:
mkdir -p /home/user/my_SE_data/exercise
cd /home/user/my_SE_data/exercise
wget https://raw.githubusercontent.com/selvaje/SE_docs/master/source/GRASS/grass_hydro.ipynb
jupyter lab /home/user/my_SE_data/exercise/grass_hydro.ipynb
Theoretical background
The first step towards modeling hydrological features is delineating a comprehensive hydrography network. DEMs at different spatial resolutions allow for the identification of stream channels, using a variety of flow-routing algorithms. Such algorithms are based on the observation that water follows the steepest and shortest route along a relief, and accumulates in valleys, lowlands, flat areas and depressions. Several algorithms have been proposed for stream network routing. These algorithms proceed in several stages: determining flow directions, resolving depressions and flat areas, and finally, calculating flow accumulation.


Methodology
Below we describe how we will extract a new high-resolution hydrography (stream-network and basins) from the 1KM DEM. In this exercise we simulate a case that we can not run the full South America continent in one tile because we reach RAM limitation. Therefore we compute the analysis in 3 tiles and then we combine the results.
We are going to use 3 GRASS commands:
r.watershed to derive flow accumulation
r.stream.extract to extract-stream network
r.stream.basins to delineate basins
Flow direction algorithms
In r.watershed there are 2 flow direction algorithms.
SFD: single flow direction (O’Callaghan, 1984). SFD concentrates the flow in only one downslope cell.
MFD: multiple flow direction (Holmgren, 1994). MFD distributites the flow among several downslope neighboring cells. The proportion of flow directed to each neighbor is determined based on the gradient or slope towards those cells.
Lectures: Flow Metrics
Prepare GRASS for hydrography extraction
Considering that GRASS can not working properly under /media/sf_LVM_shared/my_SE_data/ therefore we create a working copy of the SE_data under /home/user/my_SE_data/
Follow the code lines in the box below and in case g.extension is not working, download all git add-on repository and then install the extension:
git clone https://github.com/OSGeo/grass-addons.git grass_addons
then inside GRASS install the extension
g.extension extension=r.stream.basins url=/home/user/grass_addons/src/raster/r.stream.basins/
If you get “svn error”, install first the subversion
sudo apt install subversion
[1]:
%%bash
mkdir -p /home/user/my_SE_data/exercise
cp -r /home/user/SE_data/exercise/grassdb /home/user/my_SE_data/exercise
cd /home/user/my_SE_data/exercise
# install the GRASS add-on r.stream.basins
grass --text grassdb/europe/PERMANENT/ <<EOF
g.extension extension=r.stream.basins url=/home/user/grass_addons/src/raster/r.stream.basins
EOF
Starting GRASS GIS...
Cleaning up temporary files...
__________ ___ __________ _______________
/ ____/ __ \/ | / ___/ ___/ / ____/ _/ ___/
/ / __/ /_/ / /| | \__ \\_ \ / / __ / / \__ \
/ /_/ / _, _/ ___ |___/ /__/ / / /_/ // / ___/ /
\____/_/ |_/_/ |_/____/____/ \____/___//____/
Welcome to GRASS GIS 8.2.1
GRASS GIS homepage: https://grass.osgeo.org
This version running through: Bash Shell (/bin/bash)
Help is available with the command: g.manual -i
See the licence terms with: g.version -c
See citation options with: g.version -x
Start the GUI with: g.gui wxpython
When ready to quit enter: exit
WARNING: Extension <r.stream.basins> already installed. Re-installing...
Compiling...
Installing...
Updating extensions metadata file...
Updating extension modules metadata file...
Installation of <r.stream.basins> successfully finished
Cleaning up temporary files...
Done.
Goodbye from GRASS GIS
Inputs dataset
We are going to use the following dataset:
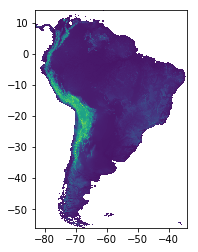
DEM at 1km resolution
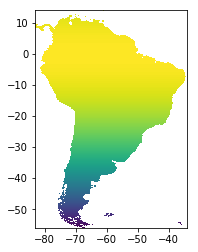
A raster grid-cell area. Each grid-cell reports the values in km^2 (produced with the r.cell.area add-on)
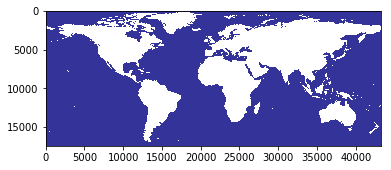
A raster land-sea mask labeled as 1-0
A raster depression labeles as 1-0
A shapefile reporting the 3 tiles
[5]:
import rasterio
from rasterio.plot import show
# digital elevation model
msk = rasterio.open("/media/sf_LVM_shared/my_SE_data/exercise/geodata/mask/msk_1km.tif")
show(msk)
[5]:
<AxesSubplot:>
[6]:
# digital elevation model
dem = rasterio.open("/media/sf_LVM_shared/my_SE_data/exercise/geodata/dem/SA_elevation_mn_GMTED2010_mn_msk.tif")
show(dem)
[6]:
<AxesSubplot:>
[9]:
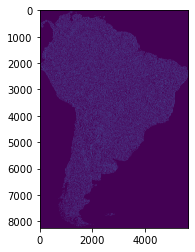
# area grid-cell in km^2
area = rasterio.open("/media/sf_LVM_shared/my_SE_data/exercise/geodata/dem/SA_are_1km_msk.tif")
show(area)
[9]:
<AxesSubplot:>
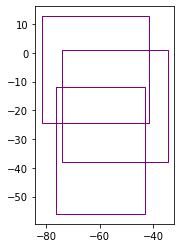
Tiling system
Due to the memory limitation of the r.watershed module (2 billion (2^31 - 1) cells), we will need to work in tiles. Each tile should be able to include the maximum number of entire basins.
[10]:
# tiles
import geopandas as gpd
gdf = gpd.read_file('/media/sf_LVM_shared/my_SE_data/exercise/geodata/shp/tilesComp.shp')
print (gdf)
gdf.plot(edgecolor="purple", facecolor="None")
id dimension Continent CropW CropS CropE CropN \
0 1 30x49 SA 0.6 0.0 2.0 2.0
1 2 40x37 SA 2.8 2.8 0.0 2.8
2 3 40x37 SA 0.3 2.8 2.8 0.0
geometry
0 POLYGON ((-76.40000 -12.00000, -43.00000 -12.0...
1 POLYGON ((-73.90000 1.00000, -34.60000 1.00000...
2 POLYGON ((-81.70000 12.70000, -41.70000 12.700...
[10]:
<AxesSubplot:>
[11]:
display(gdf)
| id | dimension | Continent | CropW | CropS | CropE | CropN | geometry | |
|---|---|---|---|---|---|---|---|---|
| 0 | 1 | 30x49 | SA | 0.6 | 0.0 | 2.0 | 2.0 | POLYGON ((-76.40000 -12.00000, -43.00000 -12.0... |
| 1 | 2 | 40x37 | SA | 2.8 | 2.8 | 0.0 | 2.8 | POLYGON ((-73.90000 1.00000, -34.60000 1.00000... |
| 2 | 3 | 40x37 | SA | 0.3 | 2.8 | 2.8 | 0.0 | POLYGON ((-81.70000 12.70000, -41.70000 12.700... |
First run: compute MFD flow accumulation for each tile
The final aim of this script session is to produce a seamless flowaccomulation for the full South America.
[2]:
%%bash
cd /media/sf_LVM_shared/my_SE_data/exercise
# use the --tmp-location option to store a temporal location in the /tmp folder
grass --text --tmp-location /media/sf_LVM_shared/my_SE_data/exercise/geodata/dem/SA_elevation_mn_GMTED2010_mn_msk.tif <<'EOF'
g.gisenv set="GRASS_VERBOSE=-1","DEBUG=0"
## import the layers
r.external input=/media/sf_LVM_shared/my_SE_data/exercise/geodata/dem/SA_elevation_mn_GMTED2010_mn_msk.tif output=elv --o --q # dem
r.external input=/media/sf_LVM_shared/my_SE_data/exercise/geodata/dem/SA_all_dep_1km.tif output=dep --o --q # depression
r.external input=/media/sf_LVM_shared/my_SE_data/exercise/geodata/dem/SA_are_1km_msk.tif output=are --o --q # area-pixel
r.external input=/media/sf_LVM_shared/my_SE_data/exercise/geodata/mask/msk_1km.tif output=msk --o --q # land-ocean mask
g.region -m
for tile in 1 2 3 ; do # loop for each tile
r.mask raster=msk --o --q # usefull to mask the flow accumulation
# extract tile extent from the tilesComp.shp
wL=$(ogrinfo -al -where " id = '$tile' " /media/sf_LVM_shared/my_SE_data/exercise/geodata/shp/tilesComp.shp | grep POLYGON | awk '{ gsub(/[(()),]/," ",$0 ); print $2 }')
nL=$(ogrinfo -al -where " id = '$tile' " /media/sf_LVM_shared/my_SE_data/exercise/geodata/shp/tilesComp.shp | grep POLYGON | awk '{ gsub(/[(()),]/," ",$0 ); print $3 }')
eL=$(ogrinfo -al -where " id = '$tile' " /media/sf_LVM_shared/my_SE_data/exercise/geodata/shp/tilesComp.shp | grep POLYGON | awk '{ gsub(/[(()),]/," ",$0 ); print $4 }')
sL=$(ogrinfo -al -where " id = '$tile' " /media/sf_LVM_shared/my_SE_data/exercise/geodata/shp/tilesComp.shp | grep POLYGON | awk '{ gsub(/[(()),]/," ",$0 ); print $7 }')
g.region w=$wL n=$nL s=$sL e=$eL res=0:00:30 --o
g.region -m
### maximum ram 66571M for 2^31 -1 (2 147 483 647 cell) / 1 000 000 * 31 M
#### -m Enable disk swap memory option: Operation is slow
#### -b Beautify flat areas
#### threshold=1 = ~1 km2 = 0.9 m2
echo "############# compute the flow accumulation using MFD for tile $tile ##############"
r.watershed -b elevation=elv depression=dep accumulation=flow drainage=dir_rw flow=are memory=2000 --o --q
echo "############# extract stream ##################"
r.stream.extract elevation=elv accumulation=flow depression=dep threshold=8 direction=dir_rs stream_raster=stream memory=2000 --o --q
echo "############# delineate basin ##################"
r.stream.basins -l stream_rast=stream direction=dir_rs basins=lbasin memory=2000 --o --q
r.colors -r stream --q ; r.colors -r lbasin --q ; r.colors -r flow --q
r.out.gdal --o -c -m createopt="COMPRESS=DEFLATE,ZLEVEL=9" type=UInt32 format=GTiff nodata=0 input=lbasin output=/media/sf_LVM_shared/my_SE_data/exercise/geodata/dem/lbasinTmp1_$tile.tif
echo "###### create a small zone flow binary for later use ###########"
r.mapcalc " small_zone_flow = if( !isnull(flow) && isnull(lbasin) , 1 , null()) " --o --q
echo "##### create a smaller box ########"
CropW=$( ogrinfo -al -where " id = '$tile' " /media/sf_LVM_shared/my_SE_data/exercise/geodata/shp/tilesComp.shp | grep " CropW" | awk '{ print $4 }' )
CropE=$( ogrinfo -al -where " id = '$tile' " /media/sf_LVM_shared/my_SE_data/exercise/geodata/shp/tilesComp.shp | grep " CropE" | awk '{ print $4 }' )
CropS=$( ogrinfo -al -where " id = '$tile' " /media/sf_LVM_shared/my_SE_data/exercise/geodata/shp/tilesComp.shp | grep " CropS" | awk '{ print $4 }' )
CropN=$( ogrinfo -al -where " id = '$tile' " /media/sf_LVM_shared/my_SE_data/exercise/geodata/shp/tilesComp.shp | grep " CropN" | awk '{ print $4 }' )
nS=$(g.region -m | grep ^n= | awk -F "=" -v CropN=$CropN '{ printf ("%.14f\n" , $2 - CropN ) }' )
sS=$(g.region -m | grep ^s= | awk -F "=" -v CropS=$CropS '{ printf ("%.14f\n" , $2 + CropS ) }' )
eS=$(g.region -m | grep ^e= | awk -F "=" -v CropE=$CropE '{ printf ("%.14f\n" , $2 - CropE ) }' )
wS=$(g.region -m | grep ^w= | awk -F "=" -v CropW=$CropW '{ printf ("%.14f\n" , $2 + CropW ) }' )
# set a smaller region to avoid border effect
g.region w=$wS n=$nS s=$sS e=$eS res=0:00:30 save=smallext --o --q # smaller region
g.region region=smallext --o --q
g.region -m
# at this point we want remove all no-entire basins. To do this we create 4 stripes of 1 pixel allong the tile borders.
echo "######## left stripe ########"
eST=$(g.region -m | grep ^e= | awk -F "=" '{ print $2 }')
wST=$(g.region -m | grep ^e= | awk -F "=" '{ printf ("%.14f\n" , $2 - ( 1 * 0.00833333333333 )) }' )
g.region n=$nS s=$sS e=$eST w=$wST res=0:00:30 --o
r.mapcalc " lbasin_wstripe = lbasin " --o --q
g.region region=smallext --o --q
echo "######## right stripe ########"
wST=$(g.region -m | grep ^w= | awk -F "=" '{ print $2 }' )
eST=$(g.region -m | grep ^w= | awk -F "=" '{ printf ("%.14f\n" , $2 + ( 1 * 0.00833333333333 )) }' )
g.region n=$nS s=$sS e=$eST w=$wST res=0:00:30 --o
r.mapcalc " lbasin_estripe = lbasin " --o --q
g.region region=smallext --o --q
echo "######## top stripe ########"
nST=$(g.region -m | grep ^n= | awk -F "=" '{ print $2 }' )
sST=$(g.region -m | grep ^n= | awk -F "=" '{ printf ("%.14f\n" , $2 - ( 1 * 0.00833333333333 )) }' )
g.region e=$eS w=$wS n=$nST s=$sST res=0:00:30 --o
r.mapcalc " lbasin_nstripe = lbasin " --o --q
g.region region=smallext --o --q
echo "######## bottom stripe ########"
sST=$(g.region -m | grep ^s= | awk -F "=" '{ print $2 }' )
nST=$(g.region -m | grep ^s= | awk -F "=" '{ printf ("%.14f\n" , $2 + ( 1 * 0.00833333333333 )) }' )
g.region e=$eS w=$wS n=$nST s=$sST res=0:00:30 --o
r.mapcalc " lbasin_sstripe = lbasin " --o --q
g.region region=smallext --o --q
# the 1 pixel strip is used to have
echo "######## remove incompleate basins ########"
cat <(r.report -n -h units=c map=lbasin_estripe | awk '{ gsub ("\\|"," " ) ; { print $1 } } ' | awk '$1 ~ /^[0-9]+$/ { print $1 } ' ) \
<(r.report -n -h units=c map=lbasin_wstripe | awk '{ gsub ("\\|"," " ) ; { print $1 } } ' | awk '$1 ~ /^[0-9]+$/ { print $1 } ' ) \
<(r.report -n -h units=c map=lbasin_sstripe | awk '{ gsub ("\\|"," " ) ; { print $1 } } ' | awk '$1 ~ /^[0-9]+$/ { print $1 } ' ) \
<(r.report -n -h units=c map=lbasin_nstripe | awk '{ gsub ("\\|"," " ) ; { print $1 } } ' | awk '$1 ~ /^[0-9]+$/ { print $1 } ' ) \
<(r.report -n -h units=c map=lbasin | awk '{ gsub ("\\|"," " ) ; { print $1 } } ' | awk '$1 ~ /^[0-9]+$/ { print $1 } ' ) \
| sort | uniq -c | awk '{ if($1==1) {print $2"="$2 } else { print $2"=NULL"} }' > /tmp/lbasin_${tile}_reclass.txt
r.reclass input=lbasin output=lbasin_rec rules=/tmp/lbasin_${tile}_reclass.txt --o --q
rm -f /tmp/lbasin_${tile}_reclass.txt
r.mapcalc " lbasin_clean = lbasin_rec" --o --q
g.remove -f type=raster name=lbasin_rec,lbasin_estripe,lbasin_wstripe,lbasin_nstripe,lbasin_sstripe --q
echo "############ export basin only for visual inspection ############"
r.mask raster=lbasin_clean --o --q
r.out.gdal --o -c -m createopt="COMPRESS=DEFLATE,ZLEVEL=9" type=UInt32 format=GTiff nodata=0 input=lbasin_clean output=/media/sf_LVM_shared/my_SE_data/exercise/geodata/dem/lbasinTmp2_$tile.tif
echo "############ output the flow accumulation ############"
r.mask raster=msk --o --q
r.mapcalc " lbasin_flow_clean = if ( !isnull(lbasin_clean ) || !isnull(small_zone_flow) , 1 , null() ) " --o --q
r.grow input=lbasin_flow_clean output=lbasin_flow_clean_grow radius=4 --o --q
r.mask raster=lbasin_flow_clean_grow --o --q
r.out.gdal --o -f -c -m createopt="COMPRESS=DEFLATE,ZLEVEL=9" nodata=-9999999 type=Float32 format=GTiff input=flow /media/sf_LVM_shared/my_SE_data/exercise/output=/media/sf_LVM_shared/my_SE_data/exercise/geodata/dem/flow_${tile}.tif
gdal_edit.py -a_ullr $wS $nS $eS $sS /media/sf_LVM_shared/my_SE_data/exercise/geodata/dem/flow_${tile}.tif
gdal_edit.py -tr 0.00833333333333333333333333333333333 -0.00833333333333333333333333333333333 /media/sf_LVM_shared/my_SE_data/exercise/geodata/dem/flow_${tile}.tif
done
EOF
projection=3
zone=0
n=14
s=-56
w=-83
e=-34
nsres=923.44150551
ewres=703.7149865
rows=8400
cols=5880
cells=49392000
projection=3
zone=0
n=-12
s=-56
w=-76.4
e=-43
nsres=924.52244935
ewres=710.89449752
rows=5280
cols=4008
cells=21162240
############# compute the flow accumulation using MFD for tile 1 ##############
############# extract stream ##################
############# delineate basin ##################
###### create a small zone flow binary for later use ###########
##### create a smaller box ########
projection=3
zone=0
n=-14
s=-56
w=-75.8
e=-45
nsres=924.64630106
ewres=707.62000721
rows=5040
cols=3696
cells=18627840
######## left stripe ########
######## right stripe ########
######## top stripe ########
######## bottom stripe ########
######## remove incompleate basins ########
############ export basin only for visual inspection ############
############ output the flow accumulation ############
projection=3
zone=0
n=1
s=-38
w=-73.9
e=-34.6
nsres=922.66504302
ewres=826.93226998
rows=4680
cols=4716
cells=22070880
############# compute the flow accumulation using MFD for tile 2 ##############
############# extract stream ##################
############# delineate basin ##################
###### create a small zone flow binary for later use ###########
##### create a smaller box ########
projection=3
zone=0
n=-1.8
s=-35.2
w=-71.1
e=-34.6
nsres=922.59157279
ewres=840.84791606
rows=4008
cols=4380
cells=17555040
######## left stripe ########
######## right stripe ########
######## top stripe ########
######## bottom stripe ########
######## remove incompleate basins ########
############ export basin only for visual inspection ############
############ output the flow accumulation ############
projection=3
zone=0
n=12.7
s=-24.5
w=-81.7
e=-41.7
nsres=921.8619211
ewres=872.86703289
rows=4464
cols=4800
cells=21427200
############# compute the flow accumulation using MFD for tile 3 ##############
############# extract stream ##################
############# delineate basin ##################
###### create a small zone flow binary for later use ###########
##### create a smaller box ########
projection=3
zone=0
n=12.7
s=-21.7
w=-81.4
e=-44.5
nsres=921.77907927
ewres=882.26518613
rows=4128
cols=4428
cells=18278784
######## left stripe ########
######## right stripe ########
######## top stripe ########
######## bottom stripe ########
######## remove incompleate basins ########
############ export basin only for visual inspection ############
############ output the flow accumulation ############
Starting GRASS GIS...
Creating new GRASS GIS location <tmploc>...
Cleaning up temporary files...
__________ ___ __________ _______________
/ ____/ __ \/ | / ___/ ___/ / ____/ _/ ___/
/ / __/ /_/ / /| | \__ \\_ \ / / __ / / \__ \
/ /_/ / _, _/ ___ |___/ /__/ / / /_/ // / ___/ /
\____/_/ |_/_/ |_/____/____/ \____/___//____/
Welcome to GRASS GIS 8.2.1
GRASS GIS homepage: https://grass.osgeo.org
This version running through: Bash Shell (/bin/bash)
Help is available with the command: g.manual -i
See the licence terms with: g.version -c
See citation options with: g.version -x
Start the GUI with: g.gui wxpython
When ready to quit enter: exit
WARNING: Color table of raster map <stream> not found
Checking GDAL data type and nodata value...
Using GDAL data type <UInt32>
Exporting raster data to GTiff format...
WARNING: Too many values, color table cut to 65535 entries
r.out.gdal complete. File <geodata/dem/lbasinTmp1_1.tif> created.
WARNING: MASK already exists and will be overwritten
Checking GDAL data type and nodata value...
Using GDAL data type <UInt32>
Exporting raster data to GTiff format...
WARNING: Too many values, color table cut to 65535 entries
r.out.gdal complete. File <geodata/dem/lbasinTmp2_1.tif> created.
WARNING: MASK already exists and will be overwritten
WARNING: MASK already exists and will be overwritten
WARNING: Precision loss: Float32 can not preserve the DCELL precision of
raster <flow>. This can be avoided by using Float64
WARNING: Forcing raster export
Checking GDAL data type and nodata value...
Using GDAL data type <Float32>
Exporting raster data to GTiff format...
WARNING: Too many values, color table cut to 65535 entries
r.out.gdal complete. File <geodata/dem/flow_1.tif> created.
WARNING: MASK already exists and will be overwritten
WARNING: Color table of raster map <stream> not found
Checking GDAL data type and nodata value...
Using GDAL data type <UInt32>
Exporting raster data to GTiff format...
WARNING: Too many values, color table cut to 65535 entries
r.out.gdal complete. File <geodata/dem/lbasinTmp1_2.tif> created.
WARNING: MASK already exists and will be overwritten
Checking GDAL data type and nodata value...
Using GDAL data type <UInt32>
Exporting raster data to GTiff format...
WARNING: Too many values, color table cut to 65535 entries
r.out.gdal complete. File <geodata/dem/lbasinTmp2_2.tif> created.
WARNING: MASK already exists and will be overwritten
WARNING: MASK already exists and will be overwritten
WARNING: Precision loss: Float32 can not preserve the DCELL precision of
raster <flow>. This can be avoided by using Float64
WARNING: Forcing raster export
Checking GDAL data type and nodata value...
Using GDAL data type <Float32>
Exporting raster data to GTiff format...
WARNING: Too many values, color table cut to 65535 entries
r.out.gdal complete. File <geodata/dem/flow_2.tif> created.
WARNING: MASK already exists and will be overwritten
WARNING: Color table of raster map <stream> not found
Checking GDAL data type and nodata value...
Using GDAL data type <UInt32>
Exporting raster data to GTiff format...
WARNING: Too many values, color table cut to 65535 entries
r.out.gdal complete. File <geodata/dem/lbasinTmp1_3.tif> created.
WARNING: MASK already exists and will be overwritten
Checking GDAL data type and nodata value...
Using GDAL data type <UInt32>
Exporting raster data to GTiff format...
WARNING: Too many values, color table cut to 65535 entries
r.out.gdal complete. File <geodata/dem/lbasinTmp2_3.tif> created.
WARNING: MASK already exists and will be overwritten
WARNING: MASK already exists and will be overwritten
WARNING: Precision loss: Float32 can not preserve the DCELL precision of
raster <flow>. This can be avoided by using Float64
WARNING: Forcing raster export
Checking GDAL data type and nodata value...
Using GDAL data type <Float32>
Exporting raster data to GTiff format...
WARNING: Too many values, color table cut to 65535 entries
r.out.gdal complete. File <geodata/dem/flow_3.tif> created.
Cleaning up temporary files...
Done.
Goodbye from GRASS GIS
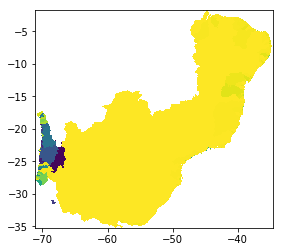
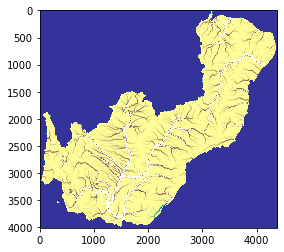
The figure below represents a basin delineation obtained with a wide region. Setting a wide region minimizes the border effect on the entire basins. This is just an intermediate step, the final output is plotted below.
[14]:
# basins tile 1
basin1 = rasterio.open("/media/sf_LVM_shared/my_SE_data/exercise/geodata/dem/lbasinTmp1_1.tif")
show(basin1)
[14]:
<AxesSubplot:>
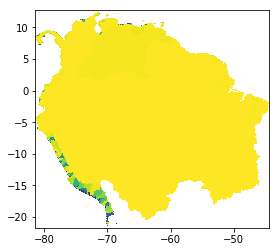
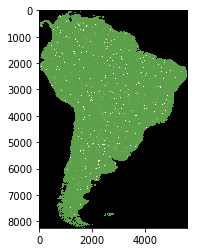
The final output of the above scripts produce the flow accumulation for each tile, saved only for the entire basins.
[15]:
# basins tile 1
basin1 = rasterio.open("/media/sf_LVM_shared/my_SE_data/exercise/geodata/dem/lbasinTmp2_1.tif")
show(basin1)
[15]:
<AxesSubplot:>
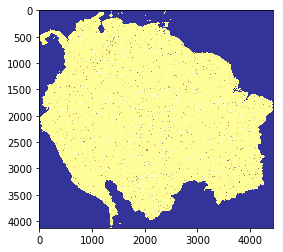
[16]:
# flow accumualtion tile 1
from matplotlib import pyplot
src = rasterio.open("/media/sf_LVM_shared/my_SE_data/exercise/geodata/dem/flow_1.tif")
pyplot.imshow(src.read(1), cmap='terrain', vmin=-4000, vmax=4000 )
pyplot.show()
[17]:
# basins tile 2
basin2 = rasterio.open("/media/sf_LVM_shared/my_SE_data/exercise/geodata/dem/lbasinTmp2_2.tif")
show(basin2)
[17]:
<AxesSubplot:>
[18]:
# flow accumualtion tile 2
src = rasterio.open("/media/sf_LVM_shared/my_SE_data/exercise/geodata/dem/flow_2.tif")
pyplot.imshow(src.read(1), cmap='terrain', vmin=-4000, vmax=4000 )
pyplot.show()
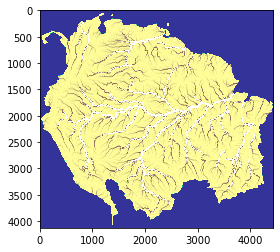
[13]:
# basins tile 3
basin3 = rasterio.open("/media/sf_LVM_shared/my_SE_data/exercise/geodata/dem/lbasinTmp2_3.tif")
show(basin3)
[13]:
<AxesSubplot:>
[19]:
# flow accumualtion tile 3
src = rasterio.open("/media/sf_LVM_shared/my_SE_data/exercise/geodata/dem/flow_3.tif")
pyplot.imshow(src.read(1), cmap='terrain', vmin=-4000, vmax=4000 )
pyplot.show()
Merge the flow accumulation tiles
[20]:
%%bash
gdalbuildvrt -srcnodata -9999999 -vrtnodata -9999999 /media/sf_LVM_shared/my_SE_data/exercise/geodata/dem/flow_all.vrt /media/sf_LVM_shared/my_SE_data/exercise/geodata/dem/flow_?.tif
gdal_translate -co COMPRESS=DEFLATE -co ZLEVEL=9 /media/sf_LVM_shared/my_SE_data/exercise/geodata/dem/flow_all.vrt /media/sf_LVM_shared/my_SE_data/exercise/geodata/dem/flow_all.tif
0...10...20...30...40...50...60...70...80...90...100 - done.
Input file size is 5616, 8244
0...10...20...30...40...50...60...70...80...90...100 - done.
[21]:
# flow accumualtion all South America
src = rasterio.open("/media/sf_LVM_shared/my_SE_data/exercise/geodata/dem/flow_all.tif")
pyplot.imshow(src.read(1), cmap='gist_earth', vmin=-4000, vmax=4000 )
pyplot.show()
Second run: copute stream and basin using the seamless South America Flow Accumulation
We repeat the same computation as before, but we use the seamless South America Flow Accumulation as the base. The final output will include basins and the stream network for each tile.
[22]:
%%bash
grass --text --tmp-location /media/sf_LVM_shared/my_SE_data/exercise/geodata/dem/flow_all.tif <<'EOF'
## import the layers
r.external input=/media/sf_LVM_shared/my_SE_data/exercise/geodata/dem/flow_all.tif output=flow --o --q # flow accumulation
r.external input=/media/sf_LVM_shared/my_SE_data/exercise/geodata/dem/SA_elevation_mn_GMTED2010_mn_msk.tif output=elv --o --q # dem
r.external input=/media/sf_LVM_shared/my_SE_data/exercise/geodata/dem/SA_all_dep_1km.tif output=dep --o --q # depression
r.external input=/media/sf_LVM_shared/my_SE_data/exercise/geodata/mask/msk_1km.tif output=msk --o --q # land-ocean mask
g.region -m
for tile in 1 2 3 ; do # loop for each tile
r.mask raster=msk --o # usefull to mask the flow accumulation
wL=$(ogrinfo -al -where " id = '$tile' " /media/sf_LVM_shared/my_SE_data/exercise/geodata/shp/tilesComp.shp | grep POLYGON | awk '{ gsub(/[(()),]/," ",$0 ); print $2 }')
nL=$(ogrinfo -al -where " id = '$tile' " /media/sf_LVM_shared/my_SE_data/exercise/geodata/shp/tilesComp.shp | grep POLYGON | awk '{ gsub(/[(()),]/," ",$0 ); print $3 }')
eL=$(ogrinfo -al -where " id = '$tile' " /media/sf_LVM_shared/my_SE_data/exercise/geodata/shp/tilesComp.shp | grep POLYGON | awk '{ gsub(/[(()),]/," ",$0 ); print $4 }')
sL=$(ogrinfo -al -where " id = '$tile' " /media/sf_LVM_shared/my_SE_data/exercise/geodata/shp/tilesComp.shp | grep POLYGON | awk '{ gsub(/[(()),]/," ",$0 ); print $7 }')
g.region w=$wL n=$nL s=$sL e=$eL res=0:00:30 --o
g.region -m
### maximum ram 66571M for 2^63 -1 (2 147 483 647 cell) / 1 000 000 * 31 M
#### -m Enable disk swap memory option: Operation is slow
#### -b Beautify flat areas
#### threshold=1 = ~1 km2 = 0.9 m2
echo "############# extract stream ##################"
r.stream.extract elevation=elv accumulation=flow depression=dep threshold=8 direction=dir_rs stream_raster=stream memory=2000 --o --q
echo "############# delineate basin and sub-basin ##################"
r.stream.basins -l stream_rast=stream direction=dir_rs basins=lbasin memory=2000 --o --q
r.colors -r stream --q; r.colors -r lbasin --q ; r.colors -r flow --q
echo "###### create a small zone flow binary for later use ###########"
r.mapcalc " small_zone_flow = if( !isnull(flow) && isnull(lbasin) , 1 , null()) " --o --q
echo "##### create a smaller box ########"
CropW=$( ogrinfo -al -where " id = '$tile' " /media/sf_LVM_shared/my_SE_data/exercise/geodata/shp/tilesComp.shp | grep " CropW" | awk '{ print $4 }' )
CropE=$( ogrinfo -al -where " id = '$tile' " /media/sf_LVM_shared/my_SE_data/exercise/geodata/shp/tilesComp.shp | grep " CropE" | awk '{ print $4 }' )
CropS=$( ogrinfo -al -where " id = '$tile' " /media/sf_LVM_shared/my_SE_data/exercise/geodata/shp/tilesComp.shp | grep " CropS" | awk '{ print $4 }' )
CropN=$( ogrinfo -al -where " id = '$tile' " /media/sf_LVM_shared/my_SE_data/exercise/geodata/shp/tilesComp.shp | grep " CropN" | awk '{ print $4 }' )
nS=$(g.region -m | grep ^n= | awk -F "=" -v CropN=$CropN '{ printf ("%.14f\n" , $2 - CropN ) }' )
sS=$(g.region -m | grep ^s= | awk -F "=" -v CropS=$CropS '{ printf ("%.14f\n" , $2 + CropS ) }' )
eS=$(g.region -m | grep ^e= | awk -F "=" -v CropE=$CropE '{ printf ("%.14f\n" , $2 - CropE ) }' )
wS=$(g.region -m | grep ^w= | awk -F "=" -v CropW=$CropW '{ printf ("%.14f\n" , $2 + CropW ) }' )
g.region w=$wS n=$nS s=$sS e=$eS res=0:00:30 save=smallext --o --q # smaller region
g.region region=smallext --o --q
g.region -m --q
echo "######## left stripe ########"
eST=$(g.region -m | grep ^e= | awk -F "=" '{ print $2 }')
wST=$(g.region -m | grep ^e= | awk -F "=" '{ printf ("%.14f\n" , $2 - ( 1 * 0.00833333333333 )) }' )
g.region n=$nS s=$sS e=$eST w=$wST res=0:00:30 --o --q
r.mapcalc " lbasin_wstripe = lbasin " --o --q
g.region region=smallext --o --q
echo "######## right stripe ########"
wST=$(g.region -m | grep ^w= | awk -F "=" '{ print $2 }' )
eST=$(g.region -m | grep ^w= | awk -F "=" '{ printf ("%.14f\n" , $2 + ( 1 * 0.00833333333333 )) }' )
g.region n=$nS s=$sS e=$eST w=$wST res=0:00:30 --o --q
r.mapcalc " lbasin_estripe = lbasin " --o --q
g.region region=smallext --o --q
echo "######## top stripe ########"
nST=$(g.region -m | grep ^n= | awk -F "=" '{ print $2 }' )
sST=$(g.region -m | grep ^n= | awk -F "=" '{ printf ("%.14f\n" , $2 - ( 1 * 0.00833333333333 )) }' )
g.region e=$eS w=$wS n=$nST s=$sST res=0:00:30 --o --q
r.mapcalc " lbasin_nstripe = lbasin " --o --q
g.region region=smallext --o --q
echo "######## bottom stripe ########"
sST=$(g.region -m | grep ^s= | awk -F "=" '{ print $2 }' )
nST=$(g.region -m | grep ^s= | awk -F "=" '{ printf ("%.14f\n" , $2 + ( 1 * 0.00833333333333 )) }' )
g.region e=$eS w=$wS n=$nST s=$sST res=0:00:30 --o --q
r.mapcalc " lbasin_sstripe = lbasin " --o --q
g.region region=smallext --o --q
echo "######## remove incompleate basins ########"
cat <(r.report -n -h units=c map=lbasin_estripe | awk '{ gsub ("\\|"," " ) ; { print $1 } } ' | awk '$1 ~ /^[0-9]+$/ { print $1 } ' ) \
<(r.report -n -h units=c map=lbasin_wstripe | awk '{ gsub ("\\|"," " ) ; { print $1 } } ' | awk '$1 ~ /^[0-9]+$/ { print $1 } ' ) \
<(r.report -n -h units=c map=lbasin_sstripe | awk '{ gsub ("\\|"," " ) ; { print $1 } } ' | awk '$1 ~ /^[0-9]+$/ { print $1 } ' ) \
<(r.report -n -h units=c map=lbasin_nstripe | awk '{ gsub ("\\|"," " ) ; { print $1 } } ' | awk '$1 ~ /^[0-9]+$/ { print $1 } ' ) \
<(r.report -n -h units=c map=lbasin | awk '{ gsub ("\\|"," " ) ; { print $1 } } ' | awk '$1 ~ /^[0-9]+$/ { print $1 } ' ) \
| sort | uniq -c | awk '{ if($1==1) {print $2"="$2 } else { print $2"=NULL"} }' > /tmp/lbasin_${tile}_reclass.txt
r.reclass input=lbasin output=lbasin_rec rules=/tmp/lbasin_${tile}_reclass.txt --o --q
rm -f /tmp/lbasin_${tile}_reclass.txt
r.mapcalc " lbasin_clean = lbasin_rec" --o --q
g.remove -f type=raster name=lbasin_rec,lbasin_estripe,lbasin_wstripe,lbasin_nstripe,lbasin_sstripe --q
echo "############ export basin sub-basin and stream ############"
r.mask raster=lbasin_clean --o --q
r.out.gdal --o -c -m createopt="COMPRESS=DEFLATE,ZLEVEL=9" type=UInt32 format=GTiff nodata=0 input=lbasin output=/media/sf_LVM_shared/my_SE_data/exercise/geodata/dem/lbasin_$tile.tif
r.out.gdal --o -c -m createopt="COMPRESS=DEFLATE,ZLEVEL=9" type=UInt32 format=GTiff nodata=0 input=stream output=/media/sf_LVM_shared/my_SE_data/exercise/geodata/dem/stream_$tile.tif
done
EOF
projection=3
zone=0
n=12.7
s=-56
w=-81.4
e=-34.6
nsres=923.4698013
ewres=706.8356204
rows=8244
cols=5616
cells=46298304
projection=3
zone=0
n=-12
s=-56
w=-76.4
e=-43
nsres=924.52244935
ewres=710.89449752
rows=5280
cols=4008
cells=21162240
############# extract stream ##################
############# delineate basin and sub-basin ##################
###### create a small zone flow binary for later use ###########
##### create a smaller box ########
projection=3
zone=0
n=-14
s=-56
w=-75.8
e=-45
nsres=924.64630106
ewres=707.62000721
rows=5040
cols=3696
cells=18627840
######## left stripe ########
######## right stripe ########
######## top stripe ########
######## bottom stripe ########
######## remove incompleate basins ########
############ export basin sub-basin and stream ############
projection=3
zone=0
n=1
s=-38
w=-73.9
e=-34.6
nsres=922.66504302
ewres=826.93226998
rows=4680
cols=4716
cells=22070880
############# extract stream ##################
############# delineate basin and sub-basin ##################
###### create a small zone flow binary for later use ###########
##### create a smaller box ########
projection=3
zone=0
n=-1.8
s=-35.2
w=-71.1
e=-34.6
nsres=922.59157279
ewres=840.84791606
rows=4008
cols=4380
cells=17555040
######## left stripe ########
######## right stripe ########
######## top stripe ########
######## bottom stripe ########
######## remove incompleate basins ########
############ export basin sub-basin and stream ############
projection=3
zone=0
n=12.7
s=-24.5
w=-81.7
e=-41.7
nsres=921.8619211
ewres=872.86703289
rows=4464
cols=4800
cells=21427200
############# extract stream ##################
############# delineate basin and sub-basin ##################
###### create a small zone flow binary for later use ###########
##### create a smaller box ########
projection=3
zone=0
n=12.7
s=-21.7
w=-81.4
e=-44.5
nsres=921.77907927
ewres=882.26518613
rows=4128
cols=4428
cells=18278784
######## left stripe ########
######## right stripe ########
######## top stripe ########
######## bottom stripe ########
######## remove incompleate basins ########
############ export basin sub-basin and stream ############
Starting GRASS GIS...
Creating new GRASS GIS location <tmploc>...
Cleaning up temporary files...
__________ ___ __________ _______________
/ ____/ __ \/ | / ___/ ___/ / ____/ _/ ___/
/ / __/ /_/ / /| | \__ \\_ \ / / __ / / \__ \
/ /_/ / _, _/ ___ |___/ /__/ / / /_/ // / ___/ /
\____/_/ |_/_/ |_/____/____/ \____/___//____/
Welcome to GRASS GIS 8.2.1
GRASS GIS homepage: https://grass.osgeo.org
This version running through: Bash Shell (/bin/bash)
Help is available with the command: g.manual -i
See the licence terms with: g.version -c
See citation options with: g.version -x
Start the GUI with: g.gui wxpython
When ready to quit enter: exit
All subsequent raster operations will be limited to the MASK area. Removing
or renaming raster map named 'MASK' will restore raster operations to
normal.
WARNING: Color table of raster map <stream> not found
WARNING: MASK already exists and will be overwritten
Checking GDAL data type and nodata value...
Using GDAL data type <UInt32>
Exporting raster data to GTiff format...
WARNING: Too many values, color table cut to 65535 entries
r.out.gdal complete. File
</media/sf_LVM_shared/my_SE_data/exercise/geodata/dem/lbasin_1.tif>
created.
Checking GDAL data type and nodata value...
Using GDAL data type <UInt32>
Exporting raster data to GTiff format...
WARNING: Too many values, color table cut to 65535 entries
r.out.gdal complete. File
</media/sf_LVM_shared/my_SE_data/exercise/geodata/dem/stream_1.tif>
created.
WARNING: MASK already exists and will be overwritten
All subsequent raster operations will be limited to the MASK area. Removing
or renaming raster map named 'MASK' will restore raster operations to
normal.
WARNING: Color table of raster map <stream> not found
WARNING: Color table of raster map <flow> not found
WARNING: MASK already exists and will be overwritten
Checking GDAL data type and nodata value...
Using GDAL data type <UInt32>
Exporting raster data to GTiff format...
WARNING: Too many values, color table cut to 65535 entries
r.out.gdal complete. File
</media/sf_LVM_shared/my_SE_data/exercise/geodata/dem/lbasin_2.tif>
created.
Checking GDAL data type and nodata value...
Using GDAL data type <UInt32>
Exporting raster data to GTiff format...
WARNING: Too many values, color table cut to 65535 entries
r.out.gdal complete. File
</media/sf_LVM_shared/my_SE_data/exercise/geodata/dem/stream_2.tif>
created.
WARNING: MASK already exists and will be overwritten
All subsequent raster operations will be limited to the MASK area. Removing
or renaming raster map named 'MASK' will restore raster operations to
normal.
WARNING: Color table of raster map <stream> not found
WARNING: Color table of raster map <flow> not found
WARNING: MASK already exists and will be overwritten
Checking GDAL data type and nodata value...
Using GDAL data type <UInt32>
Exporting raster data to GTiff format...
WARNING: Too many values, color table cut to 65535 entries
r.out.gdal complete. File
</media/sf_LVM_shared/my_SE_data/exercise/geodata/dem/lbasin_3.tif>
created.
Checking GDAL data type and nodata value...
Using GDAL data type <UInt32>
Exporting raster data to GTiff format...
WARNING: Too many values, color table cut to 65535 entries
r.out.gdal complete. File
</media/sf_LVM_shared/my_SE_data/exercise/geodata/dem/stream_3.tif>
created.
Cleaning up temporary files...
Done.
Goodbye from GRASS GIS
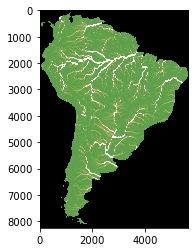
Final step: combine the tiled basins and streams
[25]:
%%bash
for var in lbasin stream ; do
gdalbuildvrt -srcnodata 0 -vrtnodata 0 /media/sf_LVM_shared/my_SE_data/exercise/geodata/dem/${var}_all.vrt /media/sf_LVM_shared/my_SE_data/exercise/geodata/dem/${var}_?.tif
gdal_translate -co COMPRESS=DEFLATE -co ZLEVEL=9 /media/sf_LVM_shared/my_SE_data/exercise/geodata/dem/${var}_all.vrt /media/sf_LVM_shared/my_SE_data/exercise/geodata/dem/${var}_all.tif
pkstat --hist -i /media/sf_LVM_shared/my_SE_data/exercise/geodata/dem/${var}_all.tif | grep -v " 0" > /media/sf_LVM_shared/my_SE_data/exercise/geodata/dem/${var}_all.hist
wc=$( wc -l /media/sf_LVM_shared/my_SE_data/exercise/geodata/dem/${var}_all.hist | awk '{ print $1 -1 }' )
# create color table
paste -d " " <( awk '{print $1}' /media/sf_LVM_shared/my_SE_data/exercise/geodata/dem/${var}_all.hist ) <(echo 0; shuf -i 1-255 -n $wc -r) <(echo 0; shuf -i 1-255 -n $wc -r) <(echo 0 ; shuf -i 1-255 -n $wc -r) | awk '{ if (NR==1) {print $0 , 0 } else { print $0 , 255 }}' > /media/sf_LVM_shared/my_SE_data/exercise/geodata/dem/${var}_all_ct.hist
echo " "
echo "color table"
head /media/sf_LVM_shared/my_SE_data/exercise/geodata/dem/${var}_all_ct.hist
echo " "
# apply color table to the stream and basins
gdaldem color-relief -co COMPRESS=DEFLATE -co ZLEVEL=9 -co TILED=YES -co COPY_SRC_OVERVIEWS=YES -alpha /media/sf_LVM_shared/my_SE_data/exercise/geodata/dem/${var}_all.tif /media/sf_LVM_shared/my_SE_data/exercise/geodata/dem/${var}_all_ct.hist /media/sf_LVM_shared/my_SE_data/exercise/geodata/dem/${var}_all_ct.tif
done
0...10...20...30...40...50...60...70...80...90...100 - done.
Input file size is 5616, 8244
0...10...20...30...40...50...60...70...80...90...100 - done.
color table
0 0 0 0 0
3271 41 27 119 255
4747 189 99 19 255
5069 163 62 44 255
8023 96 73 8 255
12022 222 70 229 255
12641 96 76 169 255
20626 153 163 32 255
32935 126 229 199 255
33148 106 201 62 255
0...10...20...30...40...50...60...70...80...90...100 - done.
0...10...20...30...40...50...60...70...80...90...100 - done.
Input file size is 5616, 8244
0...10...20...30...40...50...60...70...80...90...100 - done.
color table
0 0 0 0 0
1 254 238 233 255
2 50 225 169 255
3 41 251 170 255
4 86 208 248 255
5 167 182 86 255
6 166 178 68 255
7 85 3 145 255
8 219 168 71 255
9 216 111 188 255
0...10...20...30...40...50...60...70...80...90...100 - done.
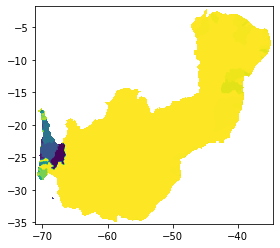
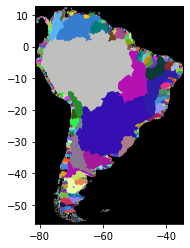
[26]:
import rasterio
from rasterio.plot import show
basins = rasterio.open("/media/sf_LVM_shared/my_SE_data/exercise/geodata/dem/lbasin_all_ct.tif")
show(basins)
[26]:
<AxesSubplot:>
[27]:
from matplotlib import pyplot
src = rasterio.open("/media/sf_LVM_shared/my_SE_data/exercise/geodata/dem/stream_all_ct.tif")
pyplot.imshow(src.read(1))
pyplot.show()
[11]:
! /usr/bin/openev/bin/openev /media/sf_LVM_shared/my_SE_data/exercise/geodata/dem/stream_all_ct.tif /media/sf_LVM_shared/my_SE_data/exercise/geodata/dem/lbasin_all_ct.tif /media/sf_LVM_shared/my_SE_data/exercise/geodata/dem/flow_all.tif
Default software rendering mode (use -h if accelerated video card installed).
Loading tools from /usr/bin/openev/tools/Tool_Export.py
Loading tools from /usr/bin/openev/tools/Tool_ShapesGrid.py
Loading tools from /usr/bin/openev/tools/Tool_DriverList.py
Acknowledgments
This material has been developed as part of the NSF-funded POSE project TI-2303651: Growing GRASS OSE for Worldwide Access to Multidisciplinary Geospatial Analytics.
[ ]: